I recently faced a strange issue where a user got an ORA-01950: no privileges on tablespace while issuing some DML statement.
A quick look on DBA_TS_QUOTAS showed that the segment owner (according to DBA_SEGMENTS) has unlimited quota on the reported tablespace.
After checking the view definition of DBA_SEGMENTS and its backing view SYS_DBA_SEGS I became a bit suspicious because the reported owner is taken from SYS.OBJ$. Could it be, that the segment is in fact owned by a different user?
Bingo! Querying SYS.SEG$ revealed that the owner of the segment (USER#) is indeed a different one than the one reported by DBA_SEGMENTS. In fact, the user did not even exist anymore.
The following query shows all segments where the segment owner does not exist anymore:
The query returned 2 rows. Both segments were non-partitioned primary key indexes on a partitioned table. Rebuilding the indexes fixed the issue but I’m still curious how this could happen.
There’s a bug on MOS (Bug 12614714) which describes a similar issue for segments for which an exchange partition operation was performed.
Here’s an excerpt from the note:
ORA-1950 updating a partitioned table
The user# in seg$ is not swapped after a partition exchange when the tables
involved are in different schemas and one of the segments (partition/
subpartition/lob fragment) is delayed, then it is likely that
you have hit this bug.
Despite that in my case no exchange partition was performed, deferred segment creation is certainly enabled. So, I assume it has something to do with that, but I was not able to think of a scenario where this could happen, nor was I able to create a reproducible test case.
It should be clear that a SQL Plan Baseline becomes non-reproducible if you change the underlying objects in a way that prevents the optimizer from using the given execution plan (e.g. by dropping an index used in the execution plan). In such a situation the plan baseline will be marked as non-reproducible.
A change in the optimizer environment can also be the reason for the optimizer not being able to reproduce a baseline. SQL Plan Baselines store a set of hints that should guide the optimizer to use the desired plan. But in some situations, not all the required hints to reproduce the exact same plan are stored in the baseline. This blog post explores these situations and gives some tips to avoid them. It also shows how such non-reproducible baselines can be made reproducible with the use of SQL Patch.
When we execute the query again, we see a note at the end of the execution plan telling us that the created baseline was used.
SQL_ID  3gurcdja09xfm, child number 0
-------------------------------------
select * from numbers where num between :fromNum and :toNum

Plan hash value: 3276288629

--------------------------------------------------------------------------
| Id  | Operation         | Name | Rows  | Bytes | Cost (%CPU)| Time     |
--------------------------------------------------------------------------
|   0 | SELECT STATEMENT  |      |       |       |     1 (100)|          |
|*  1 |  FILTER           |      |       |       |            |          |
|*  2 |   INDEX RANGE SCAN| NUM  |     1 |     3 |     1   (0)| 00:00:01 |
--------------------------------------------------------------------------

Predicate Information (identified by operation id):
---------------------------------------------------

   1 - filter(:TONUM>=:FROMNUM)
   2 - access("NUM">=:FROMNUM AND "NUM"<=:TONUM)
Note
-----
- SQL plan baseline SQL_PLAN_4vaynk3kdp6xm5792f51e used for this statement
Now let’s change an optimizer parameter and re-execute the query. We also trace the SQL_Compiler component to get more information about what’s happening behind the scenes:
SQL_ID  3gurcdja09xfm, child number 1
-------------------------------------
select * from numbers where num between :fromNum and :toNum

Plan hash value: 2824003243

-------------------------------------------------------------------------
| Id  | Operation        | Name | Rows  | Bytes | Cost (%CPU)| Time     |
-------------------------------------------------------------------------
|   0 | SELECT STATEMENT |      |       |       |     1 (100)|          |
|*  1 |  INDEX RANGE SCAN| NUM  |     1 |     3 |     1   (0)| 00:00:01 |
-------------------------------------------------------------------------

Predicate Information (identified by operation id):
---------------------------------------------------

   1 - access("NUM">=:FROMNUM AND "NUM"<=:TONUM)

Note
-----
   - Failed to use SQL plan baseline for this statement


22 rows selected.

Elapsed: 00:00:00.14
In the trace file the following lines are written:
------- START SPM Plan Dump -------
SPM: failed to reproduce the plan using the following info:
  parse_schema name        : THOMAS
  plan_baseline signature  : 5596800680717884339
  plan_baseline plan_id    : 1469248798
  plan_baseline hintset    :
    hint num  1 len 27 text: IGNORE_OPTIM_EMBEDDED_HINTS
    hint num  2 len 35 text: OPTIMIZER_FEATURES_ENABLE('18.1.0')
    hint num  3 len 20 text: DB_VERSION('18.1.0')
    hint num  4 len  8 text: ALL_ROWS
    hint num  5 len 22 text: OUTLINE_LEAF(@"SEL$1")
    hint num  6 len 51 text: INDEX(@"SEL$1" "NUMBERS"@"SEL$1" ("NUMBERS"."NUM"))
SPM: generated non-matching plan:
----- Explain Plan Dump -----
----- Plan Table -----

============
Plan Table
============
------------------------------------+-----------------------------------+
| Id  | Operation         | Name    | Rows  | Bytes | Cost  | Time      |
------------------------------------+-----------------------------------+
| 0   | SELECT STATEMENT  |         |       |       |     1 |           |
| 1   |  INDEX RANGE SCAN | NUM     |     1 |     3 |     1 |  00:00:01 |
------------------------------------+-----------------------------------+
The generated plan with help from the hints from the baseline produced a slightly different plan (no FILTER operation anymore).
This shows that the hints stored in this particular baseline are not sufficient to generate the exact same execution plan.
Instead, Oracle will now use the generated plan with the lowest cost. In this example the used plan is not much worse than the one stored in the baseline, but the key point is that the baseline was not used. In real scenarios this could mean that a possibly much worse plan is used.
Types of hints not stored in SQL Plan Baselines
From my observations the following types of hints are not stored in SQL Plan Baselines:
Optimizer parameters (opt_param(...))
Parallel hints (e.g. PARALLEL or NO_PARALLEL) when influenced by session level settings, by executing alter session force parallel query for example.
So, if the optimizer environment of the session executing the statement differs from the environment where the execution plan of the baseline was generated, there’s a potential for non-reproducible plans. This is only true if there is no regular hint leading to the same execution plan. If, for example, an execution plan is doing an index join, the SQL Plan Baseline would store the hint INDEX_JOIN. Disabling index joins on session level (alter session set "_index_join_enabled" = false) has therefore no impact on the reproducibility of the baseline.
When loading an execution plan into a SQL Plan baseline always keep in mind what optimizer environment was used to generate the plan and what optimizer environment is used by the session supposed to benefit from the SQL Plan Baseline.
Add the missing hints to the SQL statement
After we found out that our plan could not have been reproduced with the set of stored hints, the trace output can give us some valuable information about the sessions optimizer environment:
***************************************
PARAMETERS USED BY THE OPTIMIZER
********************************
  *************************************
  PARAMETERS WITH ALTERED VALUES
  ******************************
Compilation Environment Dump
_optimizer_generate_transitive_pred = false
Bug Fix Control Environment


  *************************************
  PARAMETERS WITH DEFAULT VALUES
  ******************************
...
Note that in our scenario we used the default optimizer environment to generate an execution plan to be used in the SQL Plan Baseline and an altered optimizer environment to show that the baseline is not used. It could also be the other way around, whereas we would not find any information about altered parameters in the trace file.
There are 2 ways to add the necessary hint to our statement:
Packing the SQL Plan Baseline into a staging table (DBMS_SPM.PACK_STGTAB_BASELINE), modify the hints stored in the OTHER_XML column and unpack it again.
Create a SQL Patch.
The second approach is probably more supported, so we demonstrate that one. We just add the hint opt_param('_optimizer_generate_transitive_pred' 'true')
SQL_ID  3gurcdja09xfm, child number 0
-------------------------------------
select * from numbers where num between :fromNum and :toNum

Plan hash value: 3276288629

--------------------------------------------------------------------------
| Id  | Operation         | Name | Rows  | Bytes | Cost (%CPU)| Time     |
--------------------------------------------------------------------------
|   0 | SELECT STATEMENT  |      |       |       |     1 (100)|          |
|*  1 |  FILTER           |      |       |       |            |          |
|*  2 |   INDEX RANGE SCAN| NUM  |     1 |     3 |     1   (0)| 00:00:01 |
--------------------------------------------------------------------------

Predicate Information (identified by operation id):
---------------------------------------------------

   1 - filter(:TONUM>=:FROMNUM)
   2 - access("NUM">=:FROMNUM AND "NUM"<=:TONUM)

Note
-----
   - SQL patch "SYS_SQLPTCH_0168234fa3400005" used for this statement
   - SQL plan baseline SQL_PLAN_4vaynk3kdp6xm5792f51e used for this statement


25 rows selected.

Elapsed: 00:00:00.09
We see, that the created patch and the baseline are now used again.
Final thoughts
I’m two-minded about the fact, that not all necessary hints are stored in the SQL Plan Baseline.
In case of the parallel hints it would have been easy for Oracle to add them to the baseline when necessary, but it was probably decided to intentionally not do that. If you force parallelism on the session for example, you probably don’t want to use a baseline with a serial plan.
Regarding the optimizer parameters I think a changed parameter should not be a reason for a baseline not being used.
In Oracle JDBC version 11.2 LOB prefetching was introduced. The whole point of LOB prefetching is to reduce the number of roundtrips needed to get the LOB data.
The goal of this post is to show how LOB prefetching works and point out which variables influence the optimal prefetch value.
Basics of LOB access
With JDBC driver versions older than 11.2 the behaviour when fetching LOB data is as follows: The client fetches the amount of rows, depending on the set fetch size. If the rows include a LOB column, the client is provided with a LOB locator, which is basically a pointer to the LOB in the database. There is no actual LOB data sent to the client at this point. At the point where the LOB is accessed, e.g. by calling ResultSet.getClob, the client requests the LOB metadata from the database (like LOB length and chunk size). Then in a second step, the LOB data is requested from the database.
So, for every row 2 additional roundtrips are necessary to get the LOB data.
Since JDBC version 11.2 LOB prefetching is available, which can minimize the number of roundtrips. It can be set on the DataSource, Connection, Statement or even on column level by using one of the overloaded methods OracleStatement.defineColumnType. Check the documentation for more information.
LOB Prefetching
In JDBC version 11.2 the default value for LOB prefetching is -1 which disables LOB prefetching. Since 12.1 the default is 4000.
Metadata only
By setting LOB prefetching to 0, you enable metadata prefetching. For every LOB column, the metadata is already fetched with the rest of the row data. This avoids one extra roundtrip for each row when accessing the LOB, as described earlier.
LOB prefetching
Any value higher than 0, sets the amount of LOB data to be prefetched for each LOB. For CLOB data it defines how many characters, for BLOB data how many bytes that are prefetched. So for each LOB smaller than the set prefetch size, no additional round trip to the database is necessary.
Performance
As already mentioned, the whole point of LOB prefetching is to reduce the number of round trips to the database to get the LOB data. To measure the runtime of a simple query in different scenarios, I created a small benchmark where I always fetch the same data, but the following parameters are varying:
Fetch size
LOB prefetch size
Network latency
Benchmark
All tests are done with Oracle JDBC 18.3 and Oracle Database 18.3. I’m not aware of any changes to how LOB prefetch work since version 11.2, but memory management has changed in the 12c driver, so it’s probably worth to execute the benchmark on your own if you use driver version 11.2.
The benchmark itself is done with JMH. The test class can be seen here, but here’s a wrap-up what’s going on there.
For all combinations of benchmark parameters, the following steps are performed:
Fetch 1000 rows in total.
For every row, access all the data stored in the LOB column.
The parameters are as follows:
LOB size: 4000 bytes.
Total rows: 1000.
Fetch size: 10, 100, 1000.
LOB Prefetch: -1 (disabled), 0 (metadata), 2000 (half of the LOB), 4000 (whole LOB).
Network latency: ~0.5ms, ~1.5ms. See this blog post on how to simulate network latency on Linux.
Results
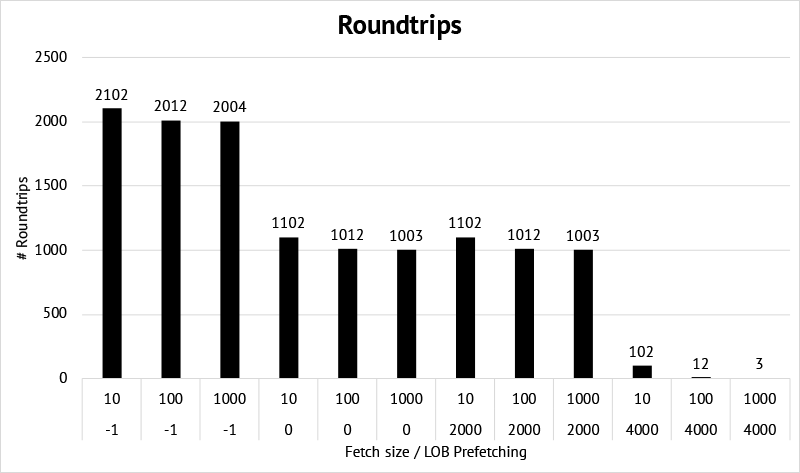
Roundtrips
Let’s first have a look at the number of roundtrips needed. The chart simply shows how many times the database waited for SQL*Net message from client.
We see that
The number of roundtrips is cut in half by using metadata prefetching.
Prefetching just part of the LOB data, results in the same number of roundtrips as when we just prefetch the metadata. This is because in this benchmark the rest of the LOB is always fetched later on.
By prefetching all the LOB data, the number of roundtrips is greatly reduced and mainly driven by the row fetch size.
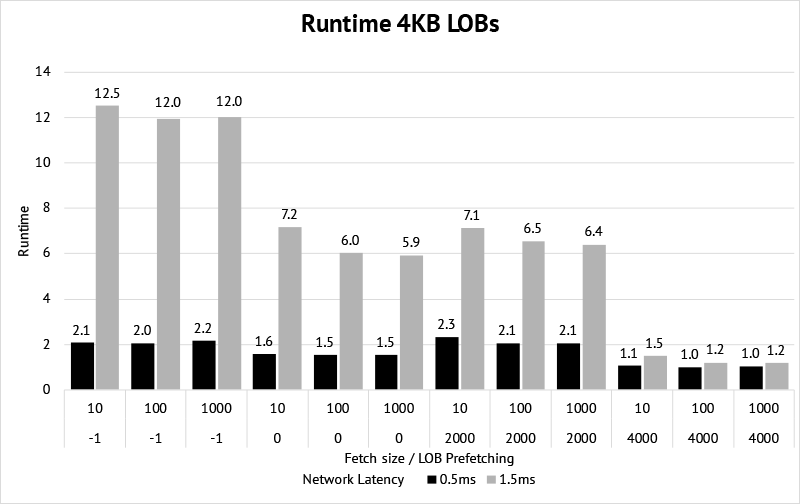
Runtime
We saw the impact the different scenarios have on the number of roundtrips. The following chart shows the average runtime out of 10 runs for the various scenarios.
The benchmark was performed with 2 different average network latencies (~0.5ms and ~1.5ms).
Note that the runtime was obfuscated and does not correspond to a real unit of time. The lowest runtime is set to 1, and the others are aligned accordingly.
We see that
The higher the latency, the bigger the impact of reducing the roundtrips by prefetching the LOBs.
Prefetching only a part of the LOB, and access the rest later is slower than only prefetching the LOB metadata. I tested it also by fetching BLOB instead of CLOB data and access it with ResultSet.getBytes. I suspect that’s because of some implementation detail in the JDBC driver and something that could change in the future.
Benchmark with 10MB LOBs
To get a feeling for what impact the size of the LOB has, I did a second benchmark with the following parameters:
LOB size: 10 MB.
Total Rows: 100.
Fetch size: 10, 100.
LOB Prefetch: -1 (disabled), 0 (metadata), 8000 (part of the LOB), 10485760 (whole LOB).
Network latency: ~0.5ms.
Here’s the result:
Note that the runtime was obfuscated and does not correspond to a real unit of time.
We see that
Metadata prefetching or prefetching just part of the LOB data, does not show any runtime improvements in this case.
Even though the improvement of fetching the whole LOB is not as big as with 4K LOB size, it’s still ~65% faster.
Bigger LOBs (and same network latency) will further diminish the relative performance improvement.
Memory Consumption
I didn’t do any measurements on client-side memory consumption but you should be aware that row fetch size and lob prefetch size affect memory consumption.
If you for example, set LOB prefetch size to 4000 and row fetch size to 1000, the driver needs at least 10 times more memory than setting the fetch size to 100.
Conclusion
With high network latency and small LOBs, the benefit of LOB prefetching will be most noticeable.
The larger the LOBs get or the lower the network latency is, the less overall time is spent for the roundtrips and the benefit will be less significant.
Setting the optimal value for LOB prefetching depends on your LOB size (or to be more precise, the amount of LOB data that is accessed), the fraction of LOBs that are really accessed (e.g. only every 10th LOB in your result set is accessed), network latency, and last but not least on your memory constraints.
As many factors come into play when setting the optimal value, you have to test it under real conditions in your environment.
If you want to run test cases that are sensitive to network latency, it’s important to also test them under the effect of different latencies.
For example you want to know what it means if you move an application currently running on the same server as the database to a different server. Or you are doing some small tests locally on your computer and want to know how they would behave in a real environment where client and server are on different machines, maybe even with long geographical distances between them.
I usually use the method described here when I want to run some tests on my laptop where I have an Oracle Database running in a Virtualbox VM.
Linux provides a kernel module called NetEm (Network Emulator). With NetEm you can add a delay to all packages leaving (outgoing) a certain network interface. You can do a lot more things with NetEm like duplicating, corrupting or reordering packages and more. Check the man page or the links at the end of this post to find out more about it.
NetEm is an enhancement of the Linux traffic control facilities and can therefore be controlled with tc.
Using the tc command line tool to add a delay
Add a delay of 10ms to eth1
tc qdisc add dev eth1 root netem delay 10ms
Change an already configured delay
tc qdisc change dev eth1 root netem delay 5ms
Show configuration of eth1
tc qdisc show dev eth1
Remove a configured delay
tc qdisc del dev eth1 root netem delay 4ms
Example
I’m just going to ping my virtual machine and add a delay after a couple of pings.
Ping my virtual machine from my local machine
ping oracle-database-183
Add delay of 10ms on eth1 on my virtual machine. This means the packages leaving eth1 (in this examples the answers to the ping) will be delayed by 10ms.
tc qdisc add dev eth1 root netem delay 10ms
Output of ping
PING oracle-database-183 (192.168.56.202): 56 data bytes
64 bytes from 192.168.56.202: icmp_seq=0 ttl=64 time=0.255 ms
64 bytes from 192.168.56.202: icmp_seq=1 ttl=64 time=0.376 ms
64 bytes from 192.168.56.202: icmp_seq=2 ttl=64 time=0.329 ms
64 bytes from 192.168.56.202: icmp_seq=3 ttl=64 time=0.336 ms
64 bytes from 192.168.56.202: icmp_seq=4 ttl=64 time=0.310 ms
64 bytes from 192.168.56.202: icmp_seq=5 ttl=64 time=10.870 ms
64 bytes from 192.168.56.202: icmp_seq=6 ttl=64 time=10.992 ms
64 bytes from 192.168.56.202: icmp_seq=7 ttl=64 time=10.910 ms
64 bytes from 192.168.56.202: icmp_seq=8 ttl=64 time=10.900 ms
64 bytes from 192.168.56.202: icmp_seq=9 ttl=64 time=10.790 ms
The output of ping clearly shows the effect of adding the delay with tc.
The dbms_xplan.display* functions have a lot of options to format the execution plan output via the format parameter. What often annoys me is the output of the SQL statement text. If, for example, you want to display all execution plans of a cursor with many child cursors and large SQL statement texts, the SQL text is returned for each child cursor and clutters your screen. Unfortunately there is no way to turn off this output with a format parameter.
Luckily we can just filter the rows returned by dbms_xplan.display* functions with a custom query. This blog post show you how. If you are just interested in how the final query looks like, click here.
Build the query
First, let’s have a look at a sample output of dbms_xplan.display_cursor for a cursor with 2 child cursors.
The highlighted lines in the output above should always occur in the output, no matter what format options are defined. They are also very easy to identify with a simple regex, so the idea is to filter out everything in between them, with some exceptions (like the Plan hash value line or the header of the execution plan table).
A couple of ways to do that come to my mind:
Create a PL/SQL function which accepts the output of the DBMS_XPLAN.DISPLAY_CURSOR function and process it procedurally row by row. I don’t want to create any objects in the database, but in 12c you could define the function in the WITH clause. As I want a solution also working on older Oracle version I don’t follow this approach.
The pattern matching functionality in 12c is very powerful and could to this job, but again, I don’t want to depend on 12c.
There must be a way to do this with analytic functions. They are available since Oracle 8i, so I’m able to use this solution on all environments I need.
First step: Use last_value analytic function
The idea is to add an additional column to the plan output which has the value 1 if the row should be display or 0 if it shouldn’t be displayed.
I use the CASE expression as a first step to mark a row to either be shown or not. In combination with the LAST_VALUE analytic function we can mark all subsequent rows the same way.
Check the output below first, to see what’s returned.
The use of NULL and the IGNORE NULLS clause in the LAST_VALUE function is important. This way, for every NULL returned by the CASE expression, the LAST_VALUE function ignores them and uses the last non-null value, which is either 1 or 0.
Note that the regex also searches for HASH_VALUE and EXPLAINED SQL STATEMENT. This is because, depending on the detail level chosen in the format parameter of the DBMS_XPLAN function, the output looks a little bit different.
 Note that the runtime was obfuscated and does not correspond to a real unit of time. The lowest runtime is set to 1, and the others are aligned accordingly.
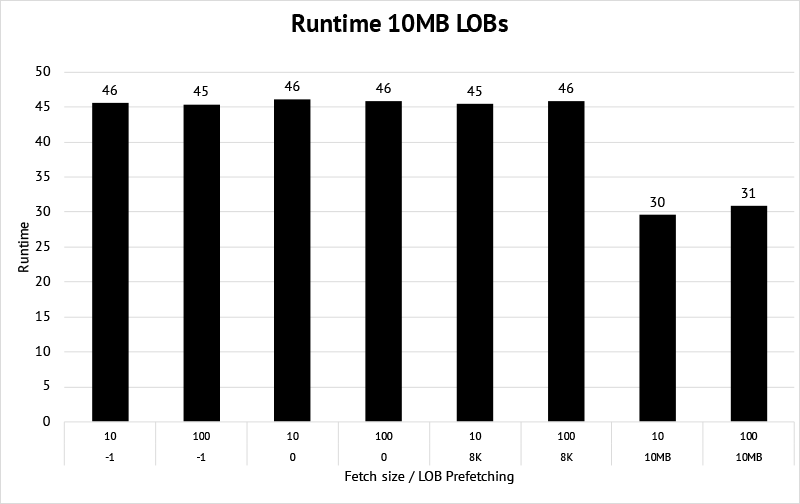 Note that the runtime was obfuscated and does not correspond to a real unit of time.